Product
Solutions
Get Complete GraphQL Observability for Modern APIs
Avoid resource-heavy, in-house tools that are costly to maintain and prone to errors. Inigo offers the absolute best observability experience for GraphQL so you can scale with confidence and efficiency.
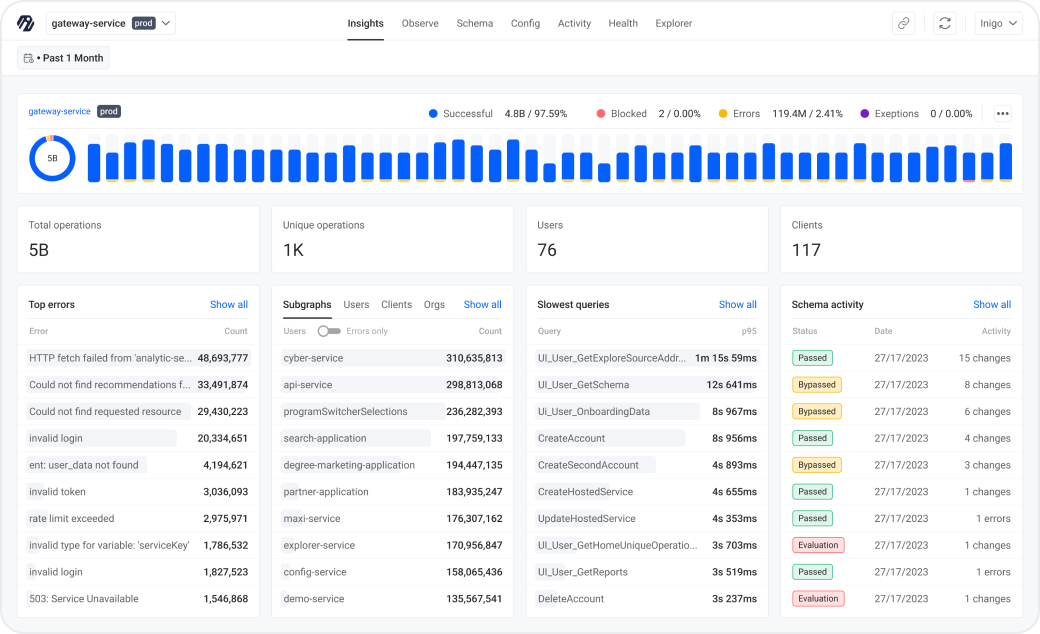
Dashboards and insights
A complete view of GraphQL usage with smart widgets for quick actions.
- Elevate hidden GraphQL errors to identify system degradation and improve user experience.
- Identify slow paths and dive deep on resource heavy queries and mutation.
- Surface top users and client for better analysis.
Deep analytics
Standard monitoring tools overlook GraphQL query insights, and valuable BI is often lost. Gain a unique and in-depth understanding of GraphQL usage — at any scale — through granular analytics into the field level, query paths and performance.
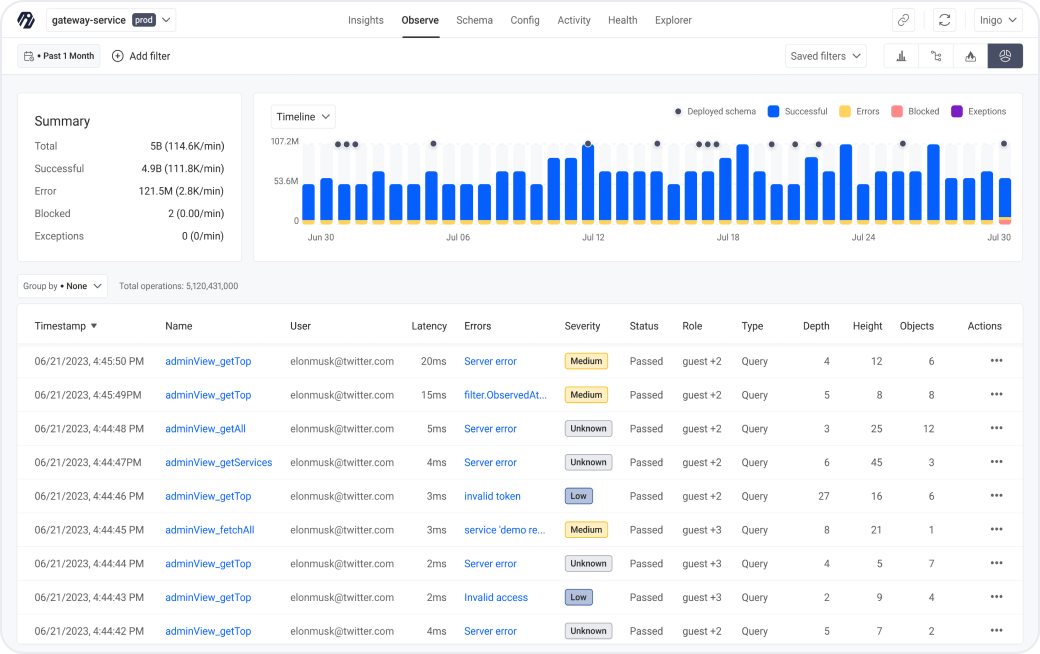
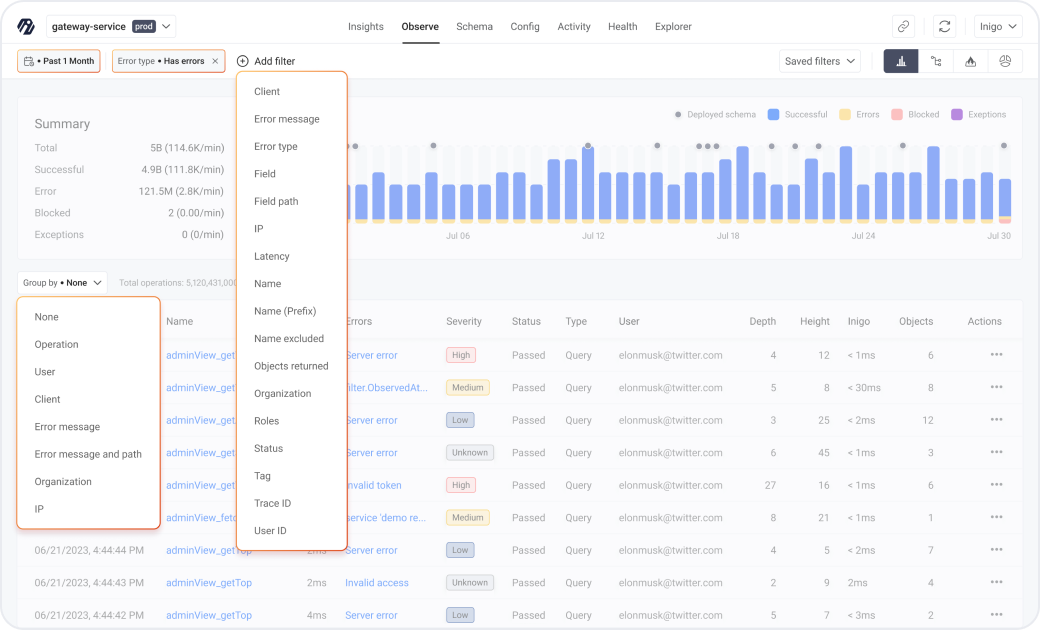
Group by and filters
Filter and group by a wide array of attributes to identify what queries are being run, where they originate from, and what payloads and errors they contain. Narrow down the queries for a window of time.
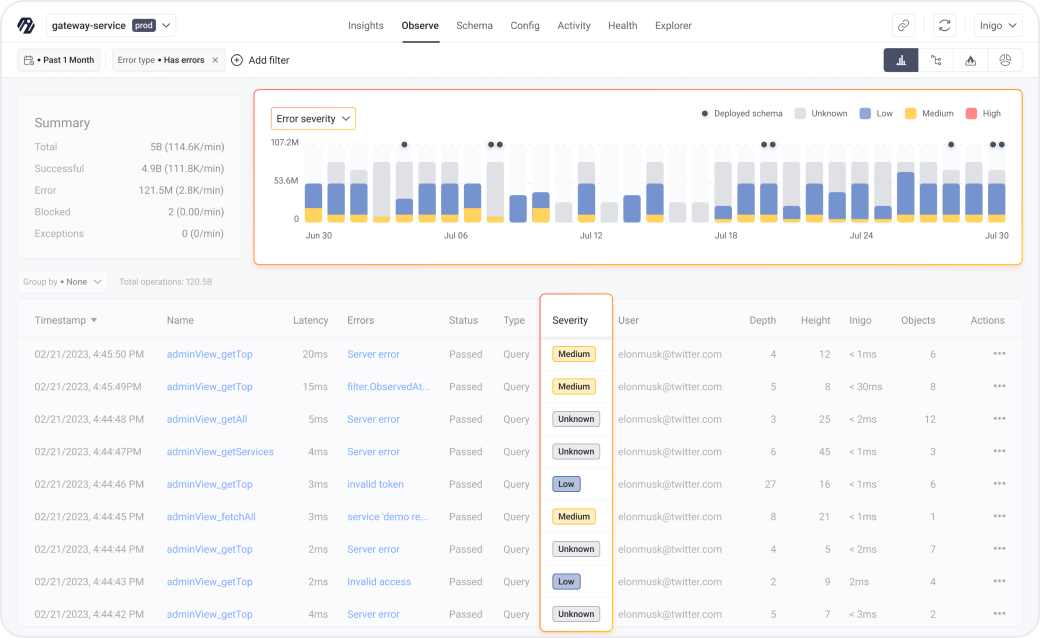
Errors impact
Error Impact allows prioritization of business-critical errors, enabling focused and efficient issue resolution where it matters most, enhancing overall system reliability.
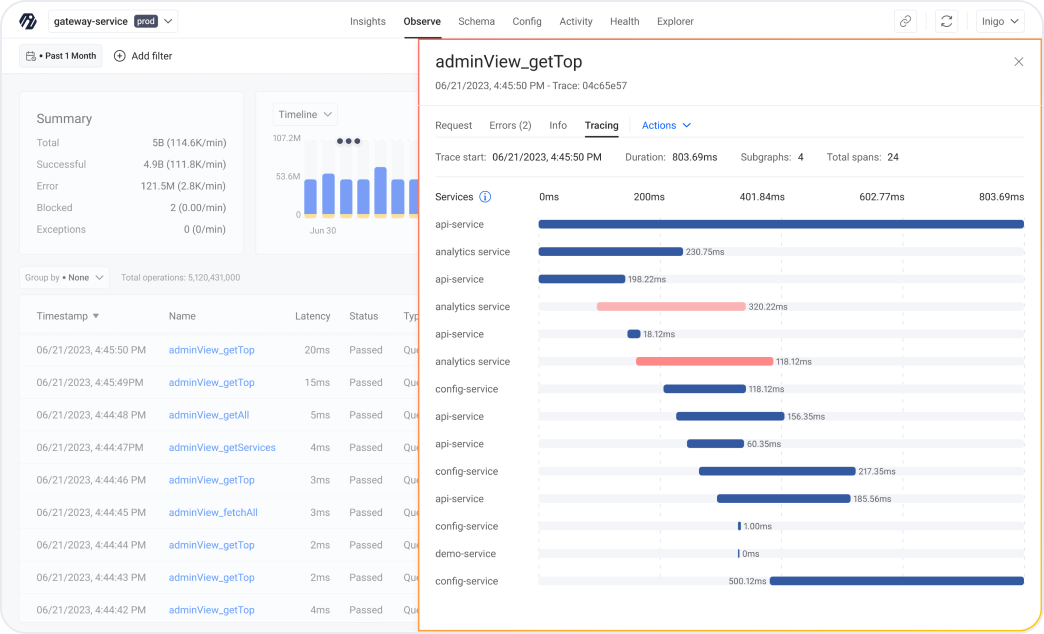
Subgraph tracing
Subgraph Tracing is crucial for optimizing GraphQL operations. It allows you to pinpoint performance bottlenecks and inefficiencies in individual subgraphs, streamlining query execution and enhancing overall system efficiency.
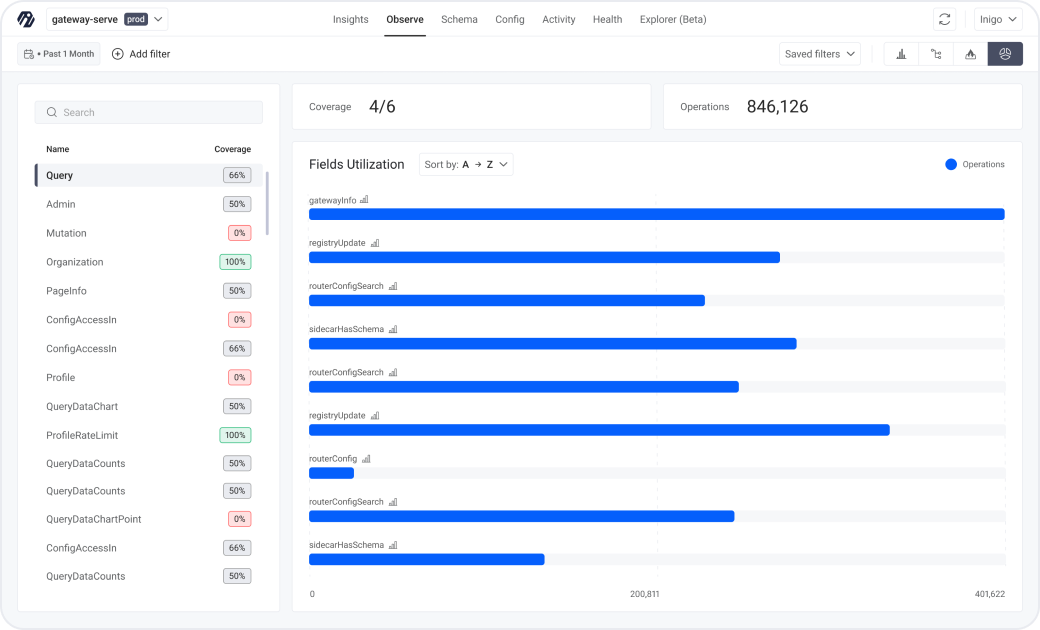
Schema coverage
Inigo's Schema Coverage provides essential insights into your GraphQL schema usage, similar to code coverage. It helps in identifying underused or redundant fields, guiding efficient schema optimization and evolution. The schema coverage view is key for strategic schema planning, ensuring development aligns with actual usage needs.
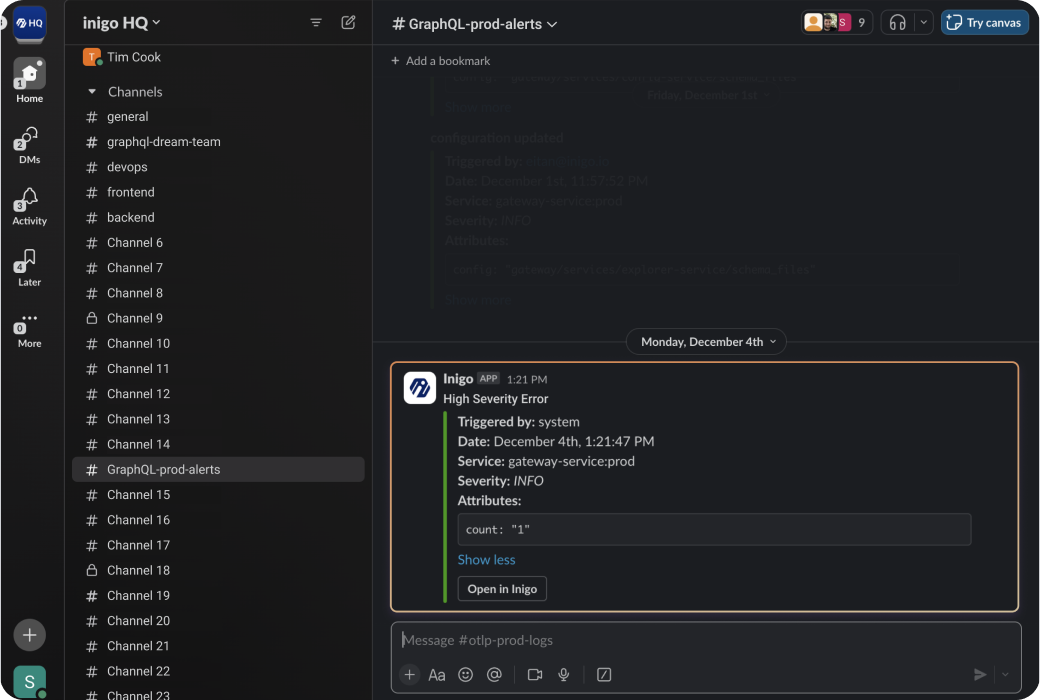
Advanced alerts with Slack integration
Advanced real-time alerts, coupled with Slack integration, offer immediate notifications on crucial GraphQL events. This ensures prompt response to issues, fostering a proactive approach to API management and team collaboration.