Product
Solutions
Our Customers Speak: Why Inigo is the Perfect Companion to DataDog for GraphQL Observability
When it comes to observability, many companies rely on DataDog for a high-level overview of their infrastructure. But when it comes to deep insights into GraphQL, a specialized tool like Inigo can offer an entirely different level of visibility. The key isn't choosing between them—it’s about leveraging both for a complete observability strategy.
Insights from a Conversation with an Inigo Customer Using DataDog
We recently spoke with an Inigo customer who also actively uses DataDog. Their experience reinforced how these two tools complement each other. Here were some of the key takeaways:
- Inigo provides GraphQL-specific insights that DataDog does not. The customer highlighted how Inigo allows them to drill down into user interactions, error messages, and operations in ways that DataDog simply isn't built for.
- The initial setup with Inigo was seamless. They were able to start sending data with minimal configuration, and the value became immediately apparent.
- DataDog remains critical for broader infrastructure monitoring, but the customer found themselves starting in Inigo when troubleshooting GraphQL issues, then moving to DataDog for deeper system-level debugging.
- They wished for tighter integration between the two tools, particularly in being able to link GraphQL request traces in Inigo with service-level logs in DataDog.
Inigo vs. DataDog: Complementary Strengths
A common concern among teams evaluating Inigo is: “Can’t we just use DataDog for everything?” The short answer? Yes, but you’ll miss out on a lot. Here’s why:
“The point is that we're not trying to replace DataDog. We're not a DataDog competitor. We're just trying to show users that there's enough value in the Inigo tool that they want both.”
While DataDog is excellent at monitoring infrastructure-wide issues, Inigo brings a GraphQL-first approach that’s critical for teams working with GraphQL APIs.
Get a free demo; book here.
Inigo Excels at User-Centric Debugging
One of the biggest advantages of Inigo is its ability to trace user interactions in ways that DataDog simply isn’t built for:
“For me, the Inigo stuff is really valuable around the user story. Like, what is the user doing? How are they interacting with it? What errors are they running into? Whereas the DataDog side is more like service level.”
“Being able to group by error message, group by user ID, group by operation—those are all extremely powerful.”
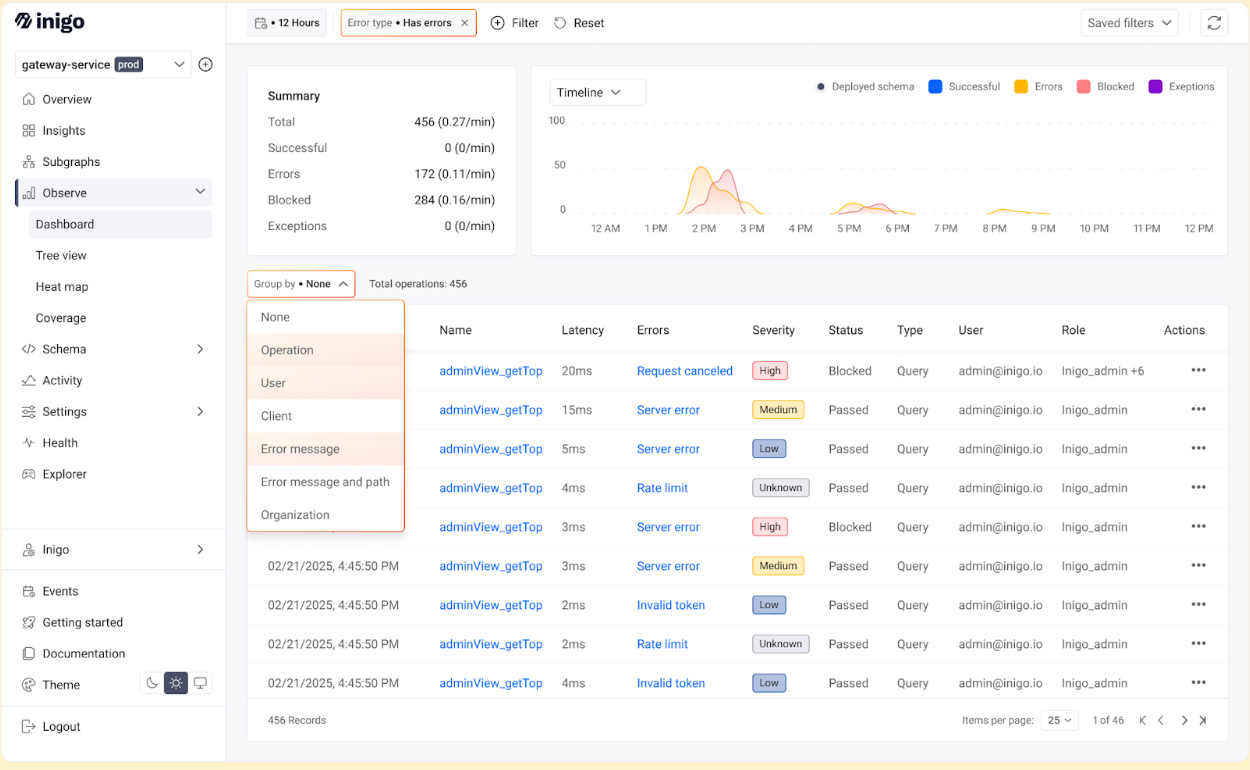
With Inigo, engineers can filter and analyze data by user behavior, error types, and GraphQL operations—something that is either impossible or extremely difficult to configure in DataDog.
Ease of Setup and Instant Value Recognition
Unlike some observability tools that require heavy lifting to integrate, Inigo is designed to be plug-and-play:
“First of all, it was really easy to just start shipping our data to Inigo. We didn’t have to change any infra. And then immediately, I was like, ‘Oh, I get it.’”
“For me, it was very quick to be like, ‘Oh, okay, I get it now’ once I could see our data in Inigo.”
Inigo makes it simple to ingest GraphQL telemetry, meaning engineers can quickly unlock insights without needing to overhaul their existing infrastructure.
The Cost of Trying to Do It All in DataDog
Technically, DataDog can provide some of the same insights as Inigo—but not without significant effort and expense:
“I think you're going to pay someone more to set that up in DataDog than what you're going to pay for Inigo.”
DataDog requires custom dashboards, tagging, and filtering rules to attempt the same level of GraphQL observability that Inigo delivers out of the box. Plus, maintaining these configurations can be an ongoing headache.
The Future: A Seamless Integration Between Inigo & DataDog?
While teams love using both Inigo and DataDog, one feature that would take things to the next level is better integration between the two:
“If there were to be a DataDog connection for Inigo stuff, that would be the only thing I actually want—how do we connect Inigo dashboards to a DataDog trace?”
“Usually, I start in Inigo because it’s easier to find the user’s interactions, and then I trace it back into DataDog to see what’s going on with the services.”
An integration would allow engineers to link GraphQL-specific insights to backend infrastructure data, creating an end-to-end observability experience.
Final Thoughts: Why You Need Both
Rather than choosing between Inigo and DataDog, the best approach is to use them together:
Use DataDog for system-wide performance monitoring, service-level metrics, and log analysis. Use Inigo for GraphQL-specific tracing, filtering, and troubleshooting at the user level. We are not a DataDog competitor, but a DataDog companion.
By running both tools in parallel, engineering teams can achieve a holistic view of their system—from high-level service health to deep, query-level GraphQL insights.
Ready to see what Inigo can do? Start exploring your GraphQL data today!