Product
Solutions
Advanced Alerts for Your GraphQL API with Inigo

GraphQL creates new challenges for traditional monitoring and alerting tools that cater to REST APIs, which depend on HTTP status codes 4xx and 5xx when things go wrong. For a GraphQL API, when things go wrong, the HTTP status code will often remain as a status code 200, but any errors will be embedded in the JSON response data in an errors field.
Monitoring tools for GraphQL APIs must support the ability to parse, log, and alert on these embedded GraphQL errors and other specific GraphQL attributes. Inigo supports advanced GraphQL monitoring and analytics that is leveraged to implement alerts.
The main use case for alerts is to provide notifications to GraphQL service operators to inform them of GraphQL query errors or critical metric thresholds being surpassed, such as rate limits, which result in a BLOCKED status.
Creating an Alerts Configuration
Inigo’s alerts can be created from the following attributes, as detailed in our Alerts doc:
- has_errors: Whether the JSON response from the GraphQL contains errors
- error: The specific error message in the response
- status: One of EXCEPTION, BLOCKED, PASSED, or NONE
- operation_type: One of QUERY, MUTATION, SUBSCRIPTION, UNKNOWN
- operation_name: The specific named GraphQL query
- client: The specific client running the operation
- tag: The specific tag for the operation
A simple Alerts configuration to generate alerts for all Login operation errors can be configured using YAML as such:
kind: Alerts
name: demo
label: prod
spec:
 alerts:
   - name: "login_errors"
     metric: calls
     window: 2m
     threshold: 5
     filters:
       operation_name: Login
       has_errors: true
The name and label should match your desired Inigo Service name and label. The Alerts configuration can be applied using Inigo’s CLI as such:
inigo apply demo-alerts.yaml
After alerts, such as an error with the Login operation, are triggered, they will be visible in the Inigo cloud under the Events screen.
Exporting Alerts to Slack
Your alerts can be exported to Slack as shown in our Alerts doc. You can send the alerts to either a public or private Slack channel where operators of your GraphQL service can see and act upon alerts as necessary.
Here is an example of an alert as shown in Slack:
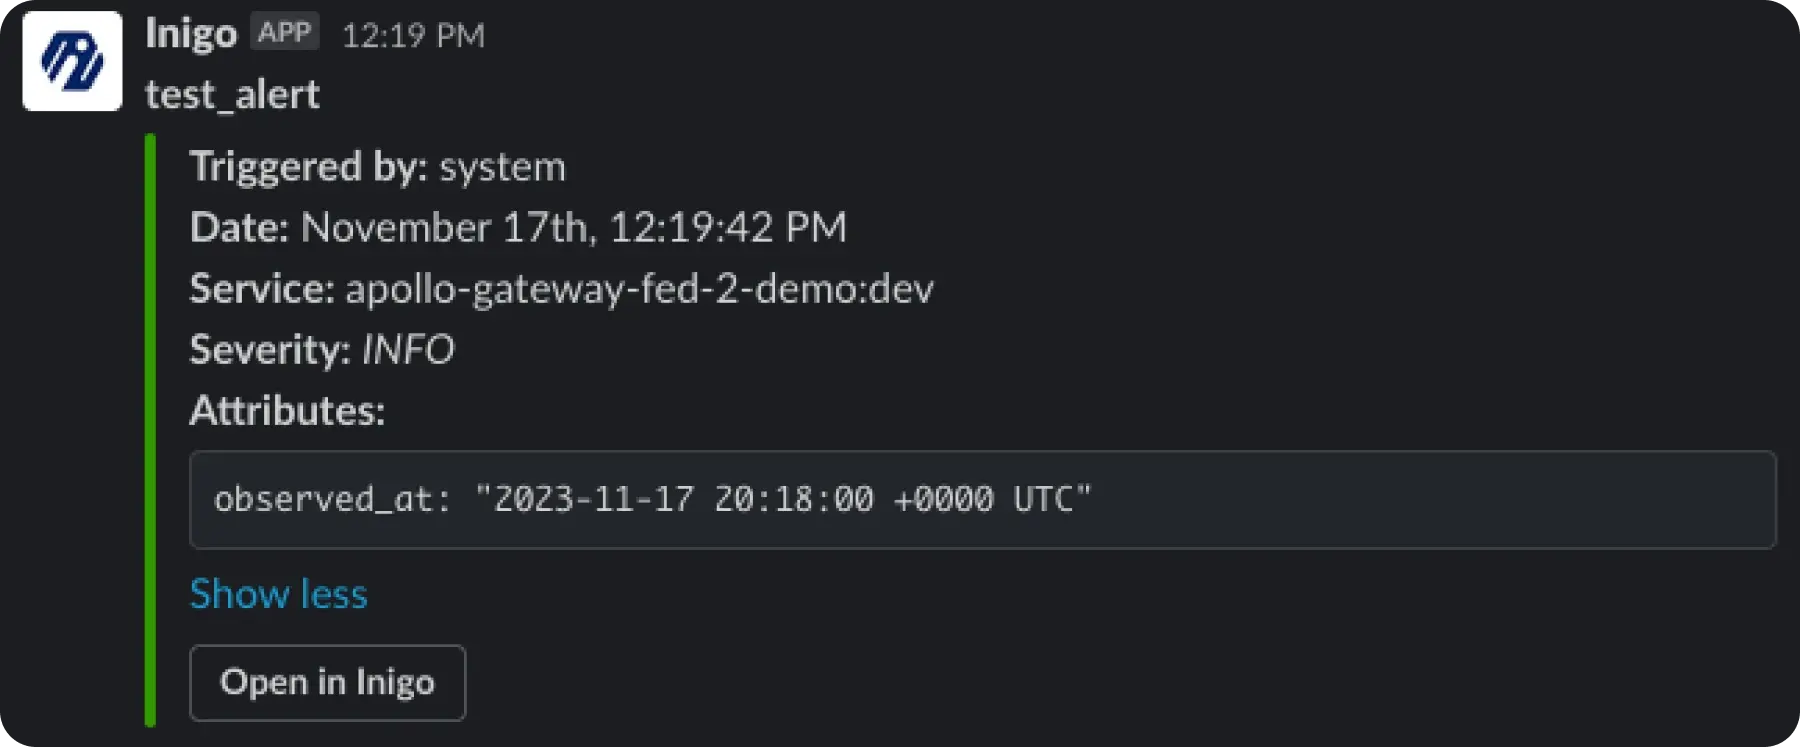
By clicking the Open in Inigo button, the operator can see specific details about the alert and begin to take action.
Conclusion
Inigo revolutionizes the way GraphQL API monitoring and alerting are implemented. Its advanced capabilities in parsing, logging, and alerting on GraphQL errors and specific attributes make it an indispensable tool for any GraphQL API. By offering customizable alert configurations and integration with platforms like Slack, Inigo ensures that GraphQL service operators stay informed and ready to act promptly on any issues.
To get started with Inigo and our Alerts implementation, you can create a free account for Inigo and follow our Getting Started guide.
Ready to take the next steps with Inigo? You can:
- Get started for free at app.inigo.io
- Book a demo today at inigo.io/demo
- Ask questions on our Slack channel